Path to World Cup 2026
A Monte Carlo simulator that runs the 2026 World Cup thousands of times. Project any nation's path to the trophy, or find the odds two rivals' paths collide.
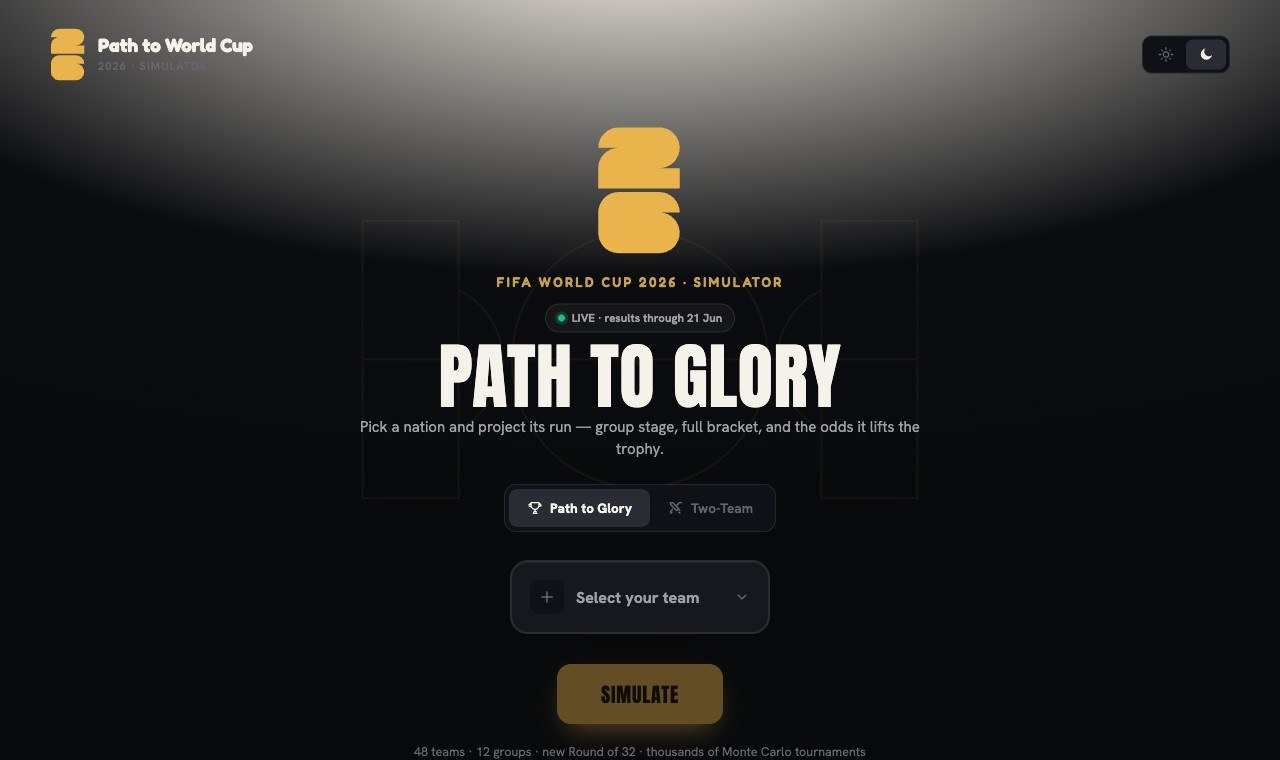
Every World Cup, the same arguments: how far can my team really go, and who will they run into? The bracket makes some draws brutal and others gentle, but fans only have gut feel and a group table to go on. A single prediction hides just how much luck the format injects.
Instead of one guess, simulate the whole tournament thousands of times. Pick a nation and watch its run play out across the group stage and bracket as a distribution: how often it reaches each round, and the trophy. Pick two teams and the simulator finds where, when, and how likely their paths collide. The answer isn't a number; it's a shape.
It started as a what if. I saw a meme ("it would be funny if the USA faced Iran in the World Cup") and got genuinely curious: what are the odds of that actually happening?
Then the better matchups piled on. Messi vs Ronaldo, one more time. Senegal vs Morocco. I wanted to know how likely any of them really were, so I built something that could run the tournament enough times to tell me.
Single-team path
Project one nation's run round-by-round, with the probability it survives each stage.
Collision finder
Choose two teams and see if, when, and how often their paths meet on the way up.
Monte Carlo engine
Thousands of full tournaments, group stage through final, aggregated into odds.
Plain-language odds
Results read as clear probabilities and round-by-round chances, not raw tables.
Pick a team, or two
Choose one nation to follow, or two to test a collision.
Run the tournaments
The engine plays the whole bracket thousands of times.
Read the path & odds
See the projected run, round chances, and collision points.
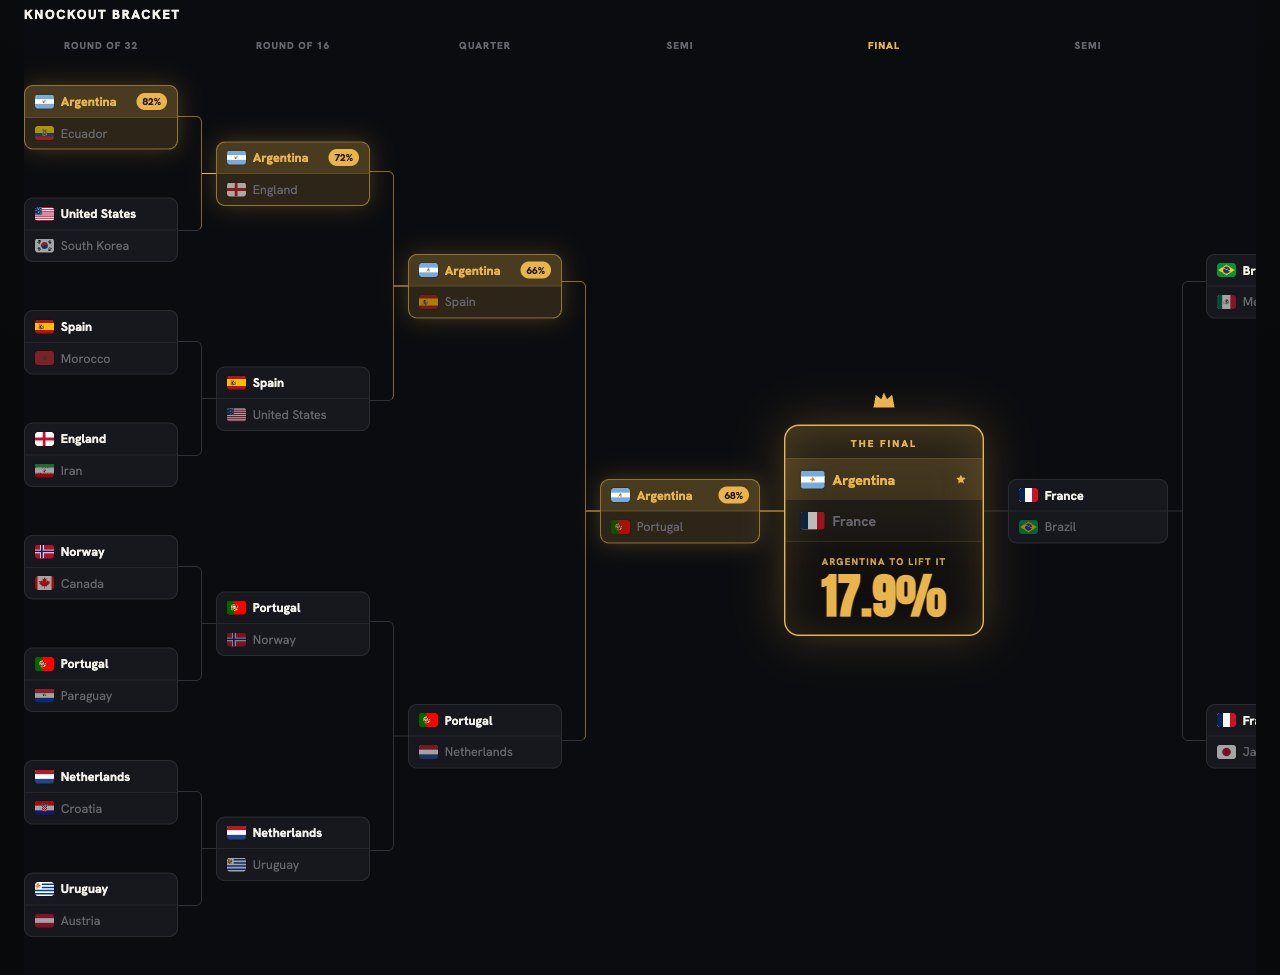
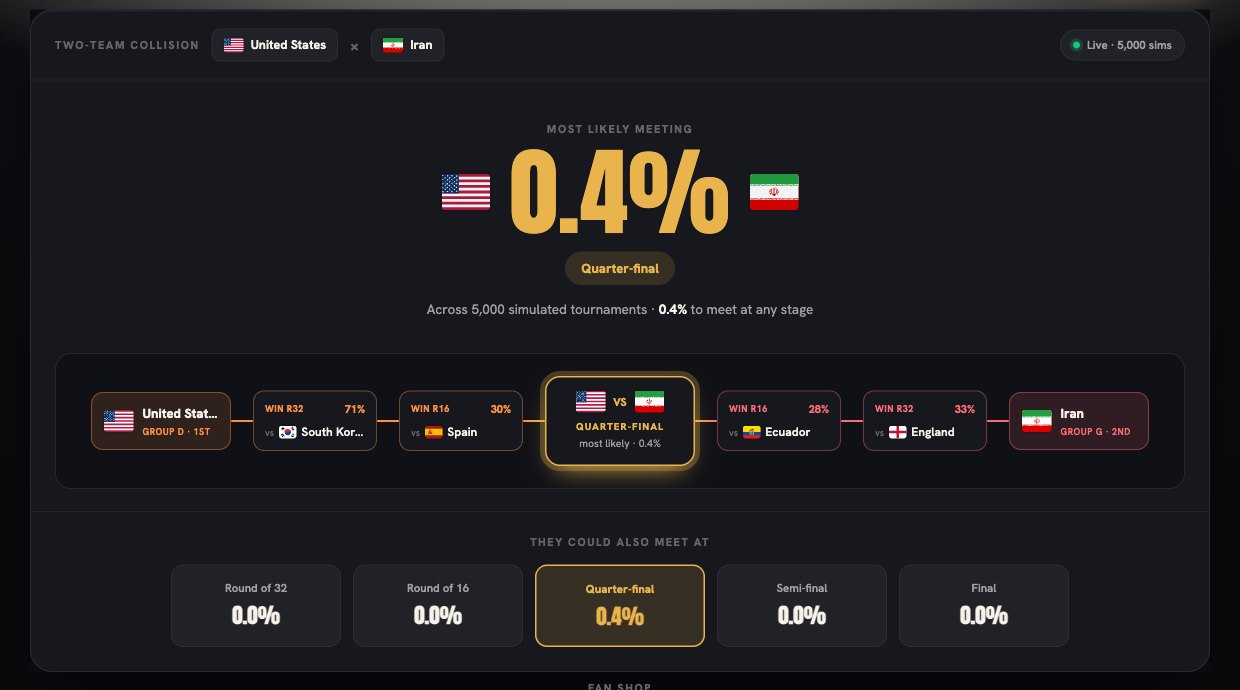
Distributions over predictions. One forecast feels certain and is usually wrong; a distribution shows the real spread the format creates.
Two questions, two modes. "How far does my team go?" and "When do we meet our rivals?" are different asks, and each gets its own focused flow.
Readable for fans, not analysts. Outputs are framed as plain chances and a visual path, so anyone can read the story without a stats background.
Run your team's path.
Pick a nation, simulate thousands of tournaments, and see how far it really goes.